Data Viewer UZH
Developed for University of Zurich, 2015-2016
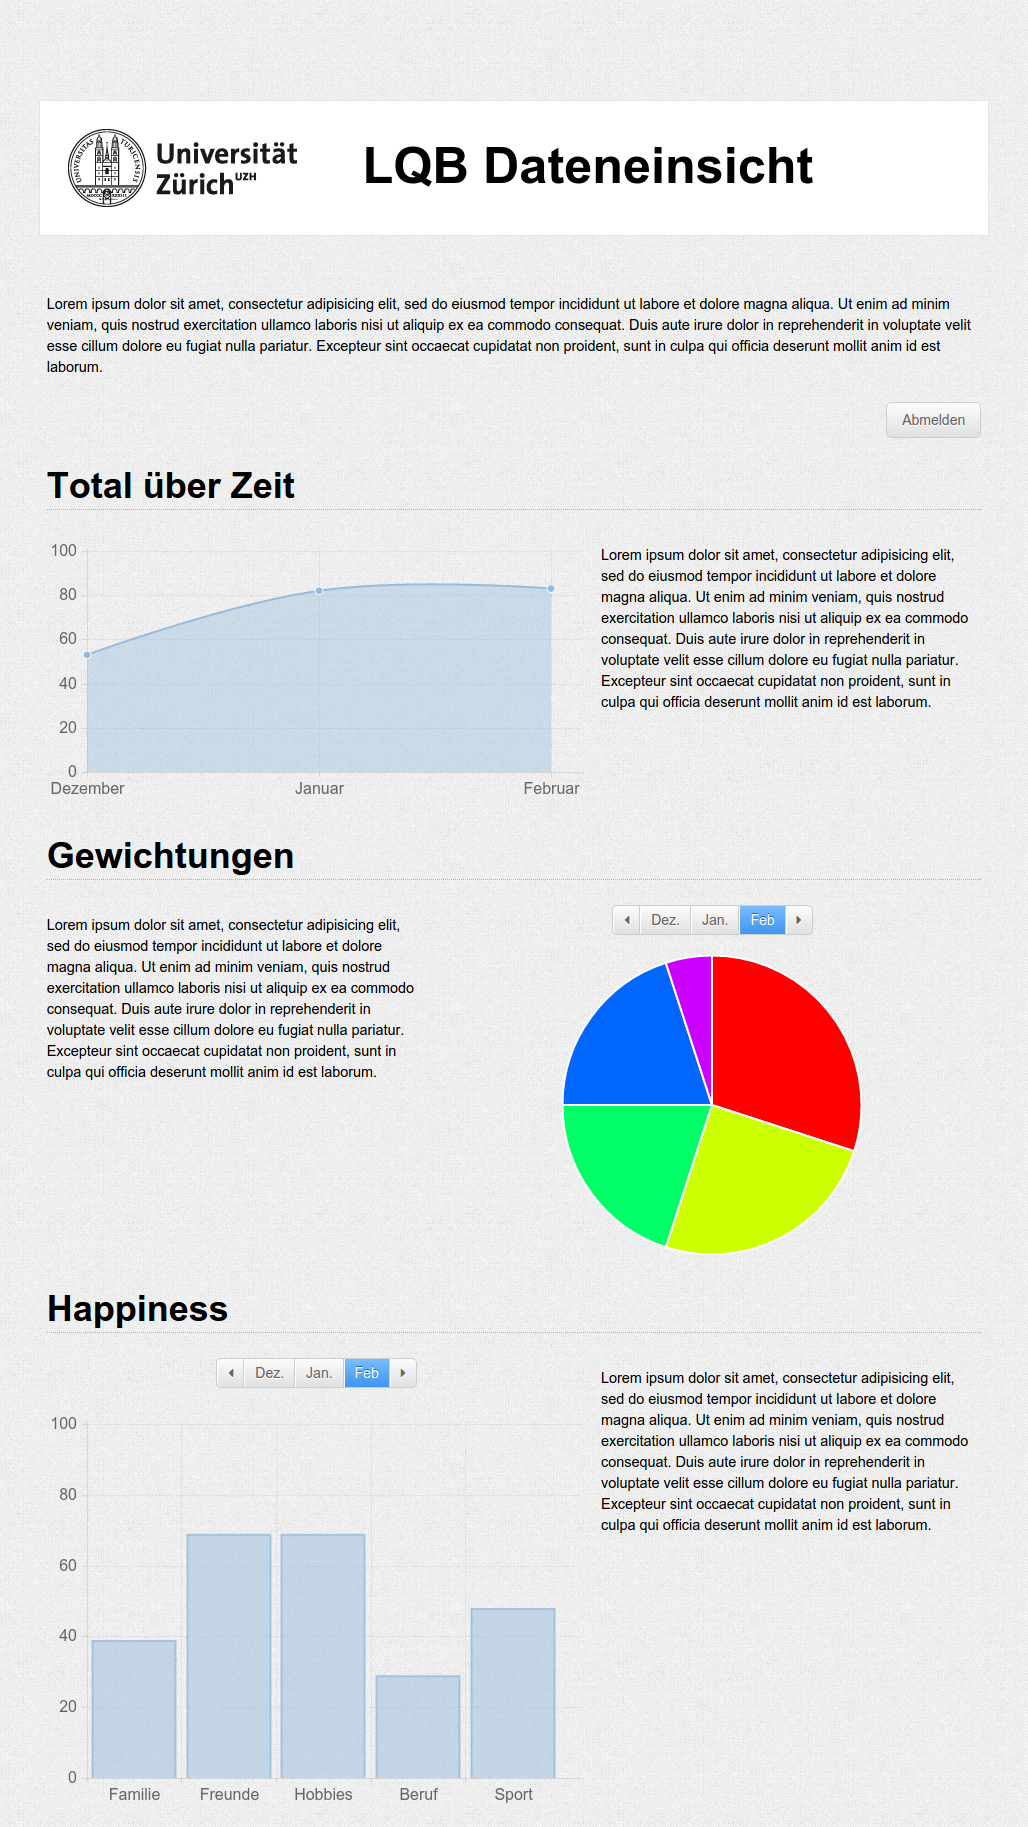
For the LQB study (Lebensqualitäts-Barometer - Life Quality Barometer) at the University of Zurich, participants fill out a questionnaire every month. The data that's gathered is available to the participants via a small website I developed. A participant can log in and the data of the last months will be displayed in interactive graphs.
The goal of this website is to let the participants see how their overall life quality develops over multiple months and which factors are influential.
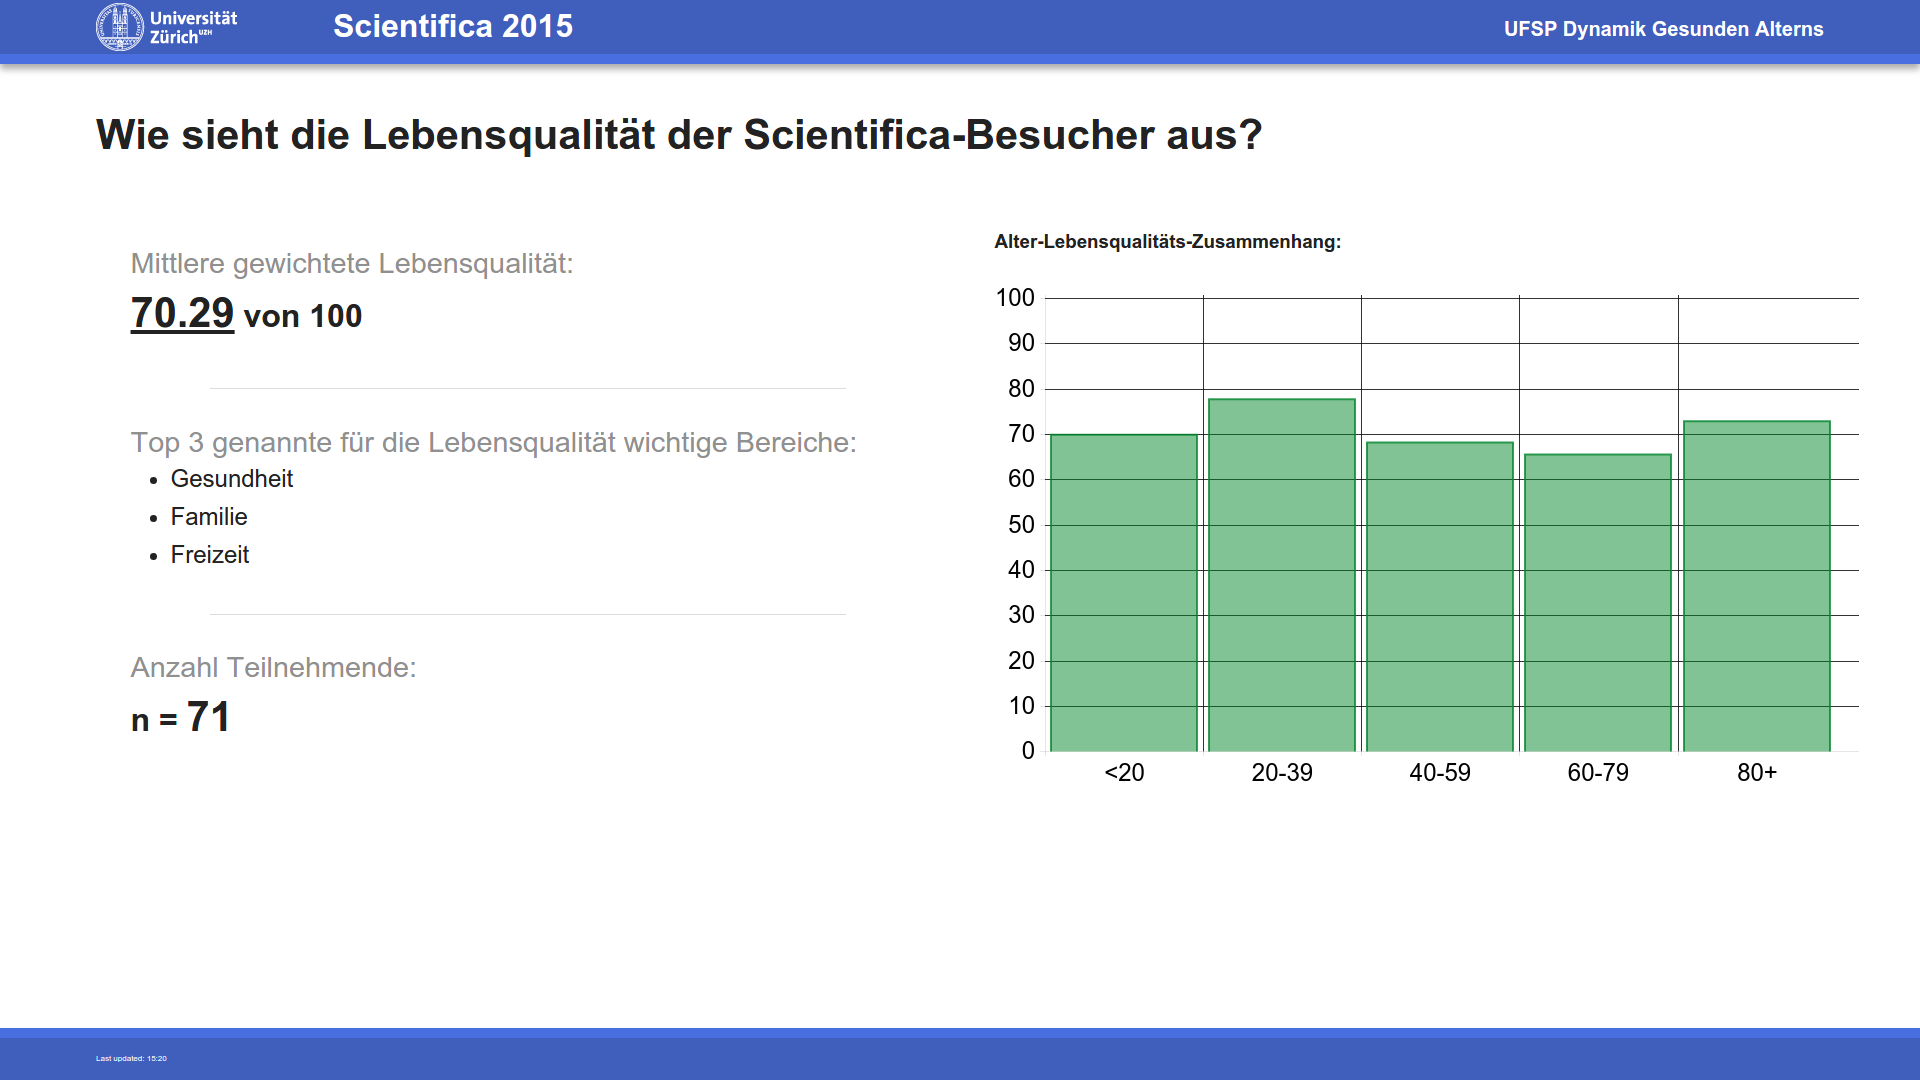
A year earlier, I created a live dashboard for the same study to use at the Scientifica 2015.
Used Technologies:
- Javascript
- jQuery
- PHP
- MySQL
- ChartJS
Scientifica 2015
Data Viewer 2016